Power Query – Cost Free Automation
A pressing issue across businesses is the continual need to do more with less, particularly without increasing costs! We have found that this can be achieved with the magical help of a cost-free tool called Power Query. Whether this tool is used in MS Office Excel or MS Power BI (Business Intelligence) Desktop, the cost-free use and benefits are the same.
What is Power Query? Microsoft describes Power Query as a data connection technology that enables you to discover, connect, combine, and refine data sources to meet your analysis requirements. Features in Power Query are available in both Excel and Power BI Desktop.
How does Power Query work? Power Query allows you to connect to source data such as Excel workbooks, CSV or Text files, Windows Explorer folders, various databases, or even internet websites and remembers the specific connections for future use. The Power Query Editor permits cleansing and transforming data (which includes tasks such as eliminating duplicates or unnecessary columns, splitting or concatenating column data, aligning data on the same row, adding or editing formulas, categorizing or summarizing data using excel functionalities such as vlookups and pivots, etc.). The Power Query Editor automatically records these steps so they can be replayed (like a macro) with the future use of the ‘Data Refresh’ functionality. Original data, cleansed data, or formula-driven data can be loaded into Excel or in memory to a Data Model where relationships between tables can be created for additional formulas or analysis. Essentially, the Power Query Editor allows for Extracting, Transforming, and Loading data (ETL).
Why is Power Query important? Power Query permits cost reduction and improved efficiencies for routine non-value-added clerical tasks such as opening / combining files or data, cleansing or transforming data as needed for your analysis, and loading the end result to the location desired. Risk of human errors is greatly reduced as a result of automating repetitive tasks, as well as the inability to change the underlying source data. Data limitation and storage are very different with the use of Power Query (Excel stores data on the Spreadsheet and Spreadsheets are limited to approximately one million rows. Power Query compresses data and stores it in memory, thus permitting you to work with at least 10 times that of Excel). Excel requires the use of vlookups to connect tables, while the Power platform forms relationships with tables to allow for easy matching of data from different tables. Finally, Power BI Desktop has significantly more advanced visualization options (such as Maps, Cards, Waterfall Charts, Treemapping, and a Question & Answer functionality – like Google), along with interactive dashboards & reporting.
When can Power Query be used? Endless opportunities in the finance and accounting areas, but also in many other departments in your organization (such as Human Resources, Purchasing, etc.). Think about the routine monthly analyses and reporting such as Journal Entry support, reconciliations, metrics, KPI’s, operational or financial analyses and reporting, as well as summary dashboards.
Who can create and use Power Queries? Database program knowledge is not necessary to learn how to create a Power Query. Typically, proficiency with Pivots and vlookups in Excel is all that is needed to get started with creating Power Queries. LinkedIn Learning courses or other internet courses are available. Our clients have also relied on us to assist in getting started. Once created, staff can be easily taught how to execute the ‘Data Refresh’ and what to look for to confirm the Refresh worked appropriately.
What can be accomplished using Power Queries? More time for analysis; reduction of human errors; consistency; and documentation. Our experience has shown that for routine monthly Journal Entry support (such as for Payroll Allocations / Accruals), typically savings from the original process to the Power Query ‘Data Refresh’ updates have averaged 2-4 hours per month for each Journal Entry. Some processes have involved spending 4-5 hours to cleanse data and again, using the Power Query ‘Data Refresh’ functionality, these typically can be reduced to approximately 10-15 minutes of preparation time. We have also improved preparation time for reconciliations from 6-8 hours per reconciliation to approximately 10-15 minutes.
Example: I was continually looking at the Internet for COVID tracking information and while it was great at showing daily data, I was not able to find the trends and comparisons I desired. I created an Excel Power Query which connected to the Wikipedia State Populations, WorldoMeter, and CovidTracking sites. Using ‘Data Refresh’ each day, I am now able to update a graph of new cases by key states to track and generate the following chart in minutes:
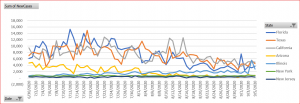
Feel free to reach out to ikappel@sirsol.com if you would like a copy of this Excel Workbook.
Also, Microsoft Power BI Desktop provides examples in their Gallery of interactive dashboards that various people have produced. The following dashboard is one example: https://community.powerbi.com/t5/Data-Stories-Gallery/COVID-19-situation-report/m-p/1213703/
This dashboard (page 1 of 17 dashboards) shows a World comparison of Cases, Deaths & Recoveries on the left; New Confirmed Cases for the last day and the last week (with % change) on the right; and a World map in the center, highlighting the overall # of Cases, Active Cases, Deaths and Recoveries.

It is important to continually assess your best path forward for achieving efficiency improvements, financial transformations, and overall process improvements.
Ilene Kappel, Director – Sirius Solutions, L.L.L.P.
If you would like further information about Automation, please complete the form below.